Finding long-term trends in your 7-Day Average Calculation that are usually disguised by occasional fluctuations can be achieved by using a rolling average.
This information can turn out to be useful when planning campaigns and various marketing decisions, along with optimizing your advertising budget.
Implementing a 7-day rolling average also proves to be beneficial when looking at data over a longer period of time, and you want to see how your business is trending.
You can use the same method below to build a monthly or quarterly rolling average as well. Or you can use this article for reference, and instead of you handling the process, you can hire our team to build out your reporting. Either way, let’s get started below with how the sauce is made.
Definition of a Rolling Average in General
A rolling average is also known as a moving average due to the nature of how we calculate it. This calculation works by selecting data over a selected period of time as each day progresses to determine where gradual positive or negative trends occur within this time frame.
As time progresses on, the time-period you calculate also moves, which is why it is also called a rolling average. Now let’s show an example with a specific time below.
Definition of a 7-Day Average Calculation
Now that you know what a rolling average is, let’s explain what a 7-day rolling average is. We simply take data from the past 7 days, add them together to get a total amount, and then divide that total by 7.
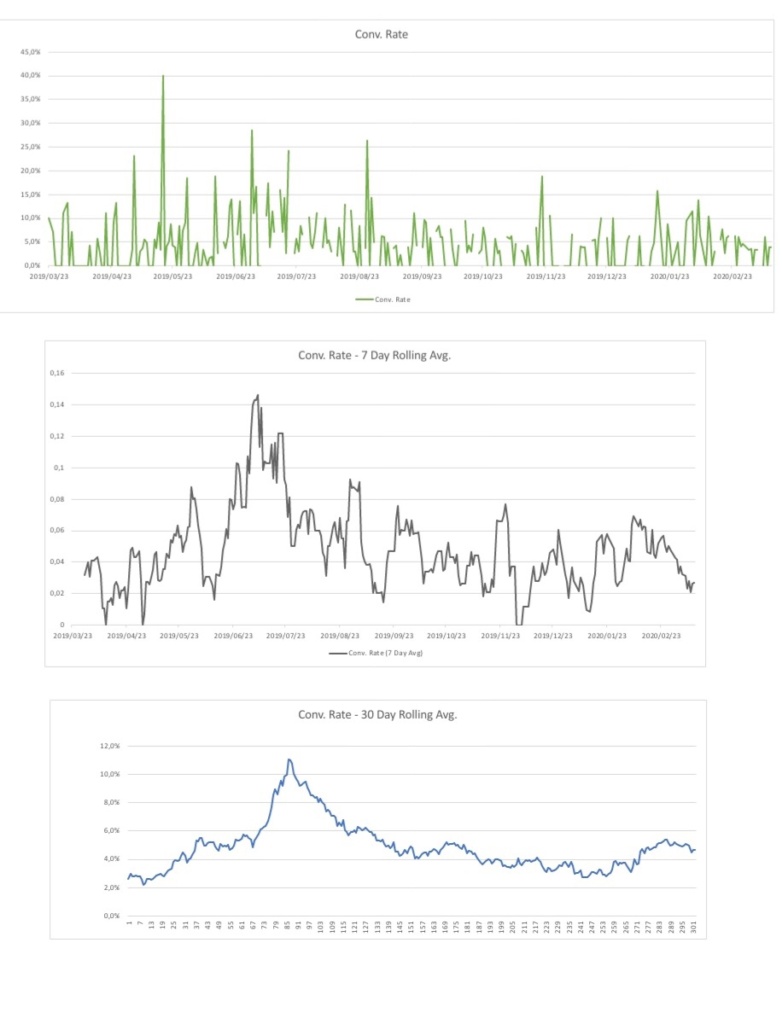
For example, day 1 + day 2 + day 3 …up to… + day 7. We then take this total amount and divide it by 7 to get an average of the previous 7 days. You do this each day, to get an average of the previous 7 days. This is going to smooth out your line graphs, as you see below.
7-Day Rolling Average Examples
Steps to Creating your 7-Day Rolling Average
1. Export the data
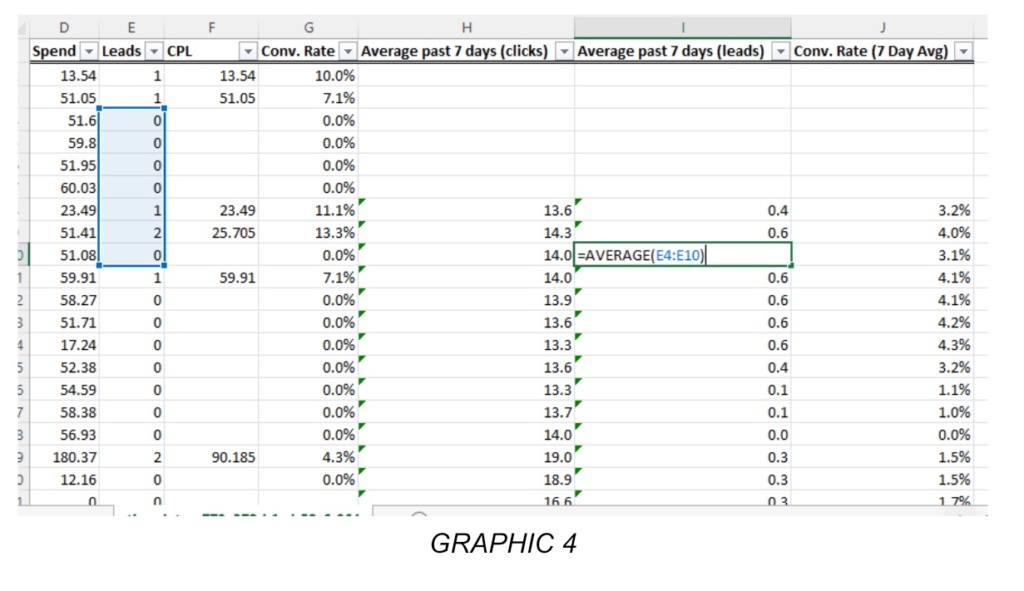
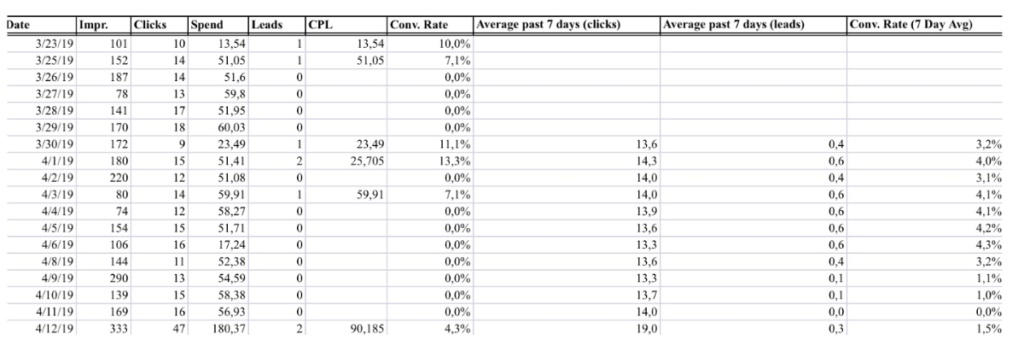
We export the data to Microsoft Excel to start the process. We’ll use the screenshot of an Excel file I’ve used below as the example to follow. Furthermore, we go to a new column, title it “7-Day Rolling Average”, and then sort your data from oldest to newest.
2. Go down to
The 7th column (according to the screenshot Graphic 4. Below), and put =AVERAGE(E2-E8) – and in the brackets put the previous 7 data points to average them out. This would be the data points you want a 7-day average of.
3. Drag the data down
Then you’ll want to drag the data down in each cell. Do this by double-clicking the small green box in the bottom-right corner of the cell with the AVERAGE formula.
4. Create your own Graph
Generate your Graph using the data from your Average column. You’ll want to highlight all the data, and Insert a Line Graph.
5. Save this file
Make sure to save this file so that as you continue to collect data, so you can easily select the next 7 days. This way the 7-day average, you guessed it, keeps on rolling!
6. PRO-TIP
Make sure you save your file as an Excel Workbook, not a CSV – as a CSV will delete all your formulas and extra tabs if you save it, exit it, and try to re-open.
7. Get a better understanding
From here, you will have a more profound understanding of your business’s performance and informed decision-making. Along with turning your occasional positive molehills into mountains of success and growth.
8. Become a data wizard
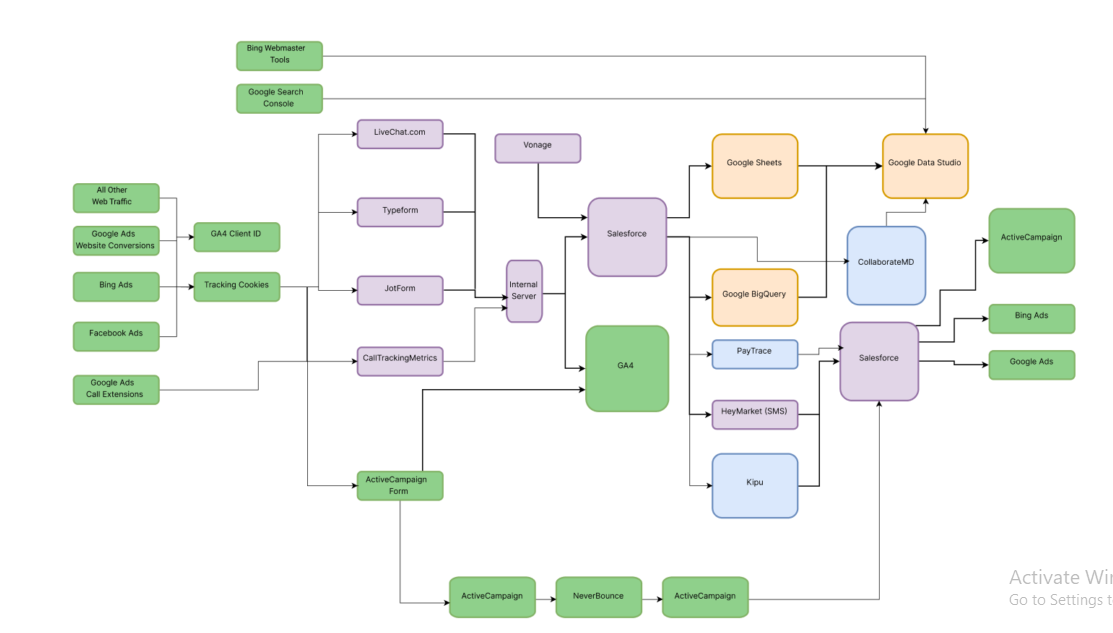
To truly become a data wizard, you’ll want to automate this entire process in a system like Google Data Studio, Tableau, Salesforce Reports & Dashboards, etc. If not, you’re stuck doing this each day, every day, manually – and who wants that!
The 7-day roll was developed to make it easier for companies to see exactly what’s happening. Intervals of growth or decline are generally hidden among the swings of information. Knowing which periods performed the best allows the business to then cross-reference with both their CRM and Google Analytics Data.
Assuming that at the beginning of April the business invested in ABC Advertising, then ran it for just a short time, we see a spike in customers/visitors.
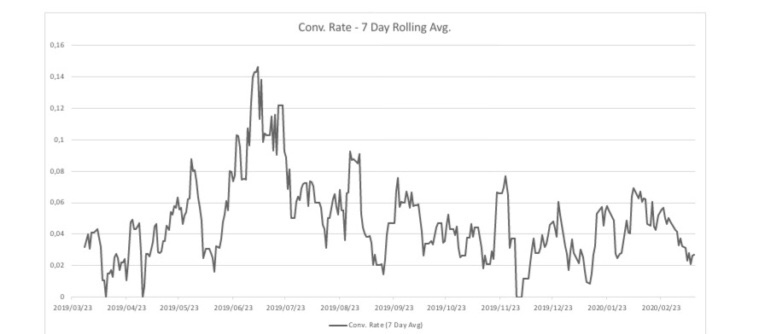
The graph shows a defined drop in the audience immediately after the period. However, this is made clear in the Rolling Average graph.
The business then invests in various advertising. The graph gives off a form of consistency and is more beneficial to someone who’s looking for individual days of performance due to campaign spikes, launches, or issues.
On the other hand, the Conversion rate graph is much more practical when monitoring long-term trends of the business. As you can see, the company then analyzed the positive peaks of the Graph throughout the year and was able to invest further in the correct marketing campaign (or implement the right changes).
Benefits of a 7-day rolling average
- It simplifies the identification of long-term trends concealed by daily fluctuations.
- Helps you pinpoint the best sales or visitation periods.
- Allows you to understand the factors influencing trends.
- Assists in making informed decisions related to production, staff briefings, and marketing strategies.
- Increases productivity, growth, and profit by interpreting and applying data effectively.
You can optimize your business performance by following the steps to generating your 7-Day Rolling Average Graph Alternatively, you can contact our team, and we’ll be happy to assist you.
Ready to uncover hidden data trends? Start your 7-Day Average Calculation journey today.
I have been working in digital marketing for over 10 years, from an intern to Chief Marketing Officer overseeing a $40,000,000 annual budget, advertising in paid search, SEO, television, radio, pay per lead calls, and much more.
About us and this blog
We are a digital marketing company with a focus your entire journey through search - website creation, lead generation, tracking & analysis, & CRM integrations. In this blog we will explain our processes and ideas you can use with your company for better performance.
Request a free quote
We offer professional digital marketing services that help websites improve the performance of their online marketing. Contact us to discuss your website & marketing plans.
More from our blog
See all posts


Recent Posts
- Why you should integrate Jotform to Google Sheets and how to do it February 22, 2024
- Set Up Google Analytics 4: Beginner’s Guide February 15, 2024
- Mobile CTA Optimization: Strategies and Challenges September 11, 2023